
Mapping resident priorities for greener, healthier communities
Helping South and West Los Angeles communities guide $48 million in state funding toward greener, healthier, and more climate-ready neighborhoods.
USC Launched 2025
Share this page

Impact
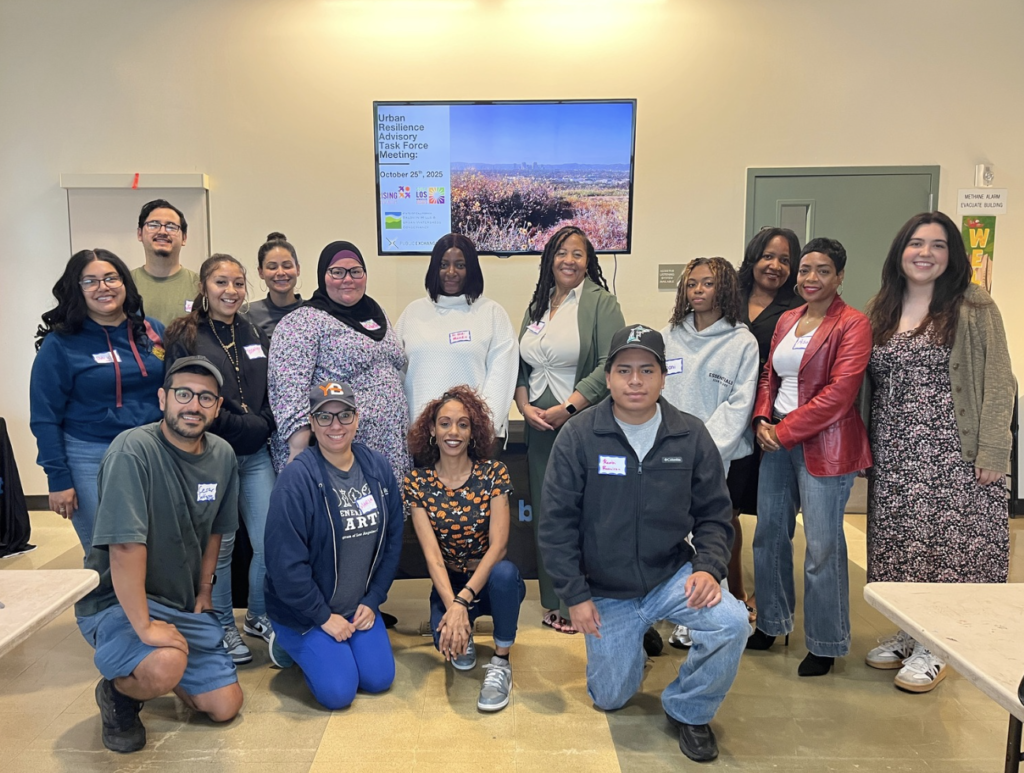
People who know their neighborhoods best should have a say in how they are improved. We’re helping South and West Los Angeles residents put their priorities on the map—from cooler streets and better parks to cleaner waterways and more green space—so the Baldwin Hills and Urban Watersheds Conservancy can target new funding toward projects that make everyday life healthier, safer, and more resilient.
$48 million in funding directed to local priorities
250+ residents engaged in planning
Challenge
The Baldwin Hills and Urban Watersheds Conservancy’s territory recently grew from 2,000 to 44,000 acres, dramatically expanding the population of people impacted by decisions about parks, waterways, green space, and climate resilience. Residents understand what their own neighborhoods need, but they often lack a clear way to share their ideas, influence public investments, or connect promising projects with funding.
Approach
We’re helping the Conservancy create a more community-driven approach to public investment. Working with Rising Communities and Esri, we’re building an interactive mapping tool that brings resident knowledge and environmental data together so communities can identify local needs, propose solutions, and shape where funding goes. We’re also evaluating the model to demonstrate its value and help other conservancies and public agencies adopt and improve it—giving historically underserved communities greater say in how public dollars are invested.
Project Goals
Shape a shared vision
Draft the Conservancy’s Watershed & Open Space Improvement Plan, turning community input into a clear set of values and priorities for future grantmaking.
Map resident needs
Provide a user-friendly tool where residents can propose solutions for their neighborhoods and have a voice in future investments.
Build a model for scale
Share lessons that can help other public agencies make more transparent, community-driven decisions.
Approach
We’re combining community knowledge, environmental data, and public planning to help the Conservancy understand where investments are needed—and what residents want those investments to accomplish.

Community Engagement
Spatial Analysis
Program Evaluation

Community-Led Planning
UVI Mapping tool
Explore the Urban Vulnerability Index Mapping Tool to see where environmental and social challenges overlap across the Conservancy’s territory.
The map combines eight measures—from extreme heat and flood risk to park access and tree canopy—to show where needs are greatest. Residents and organizations can explore local conditions, propose or comment on projects, and download reports to support planning and grant applications.
Recent Updates
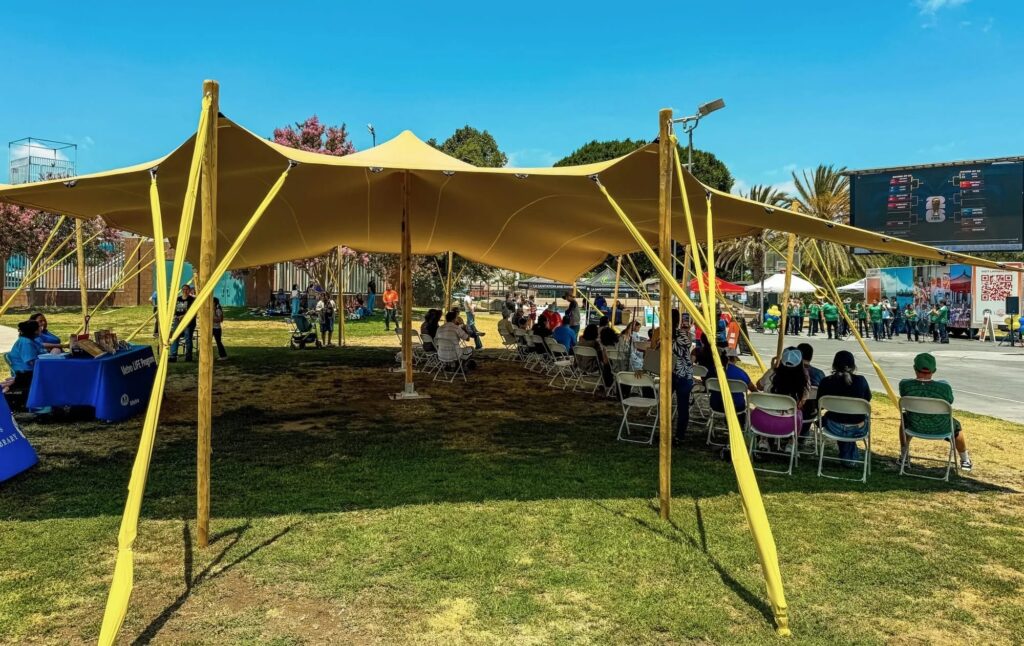
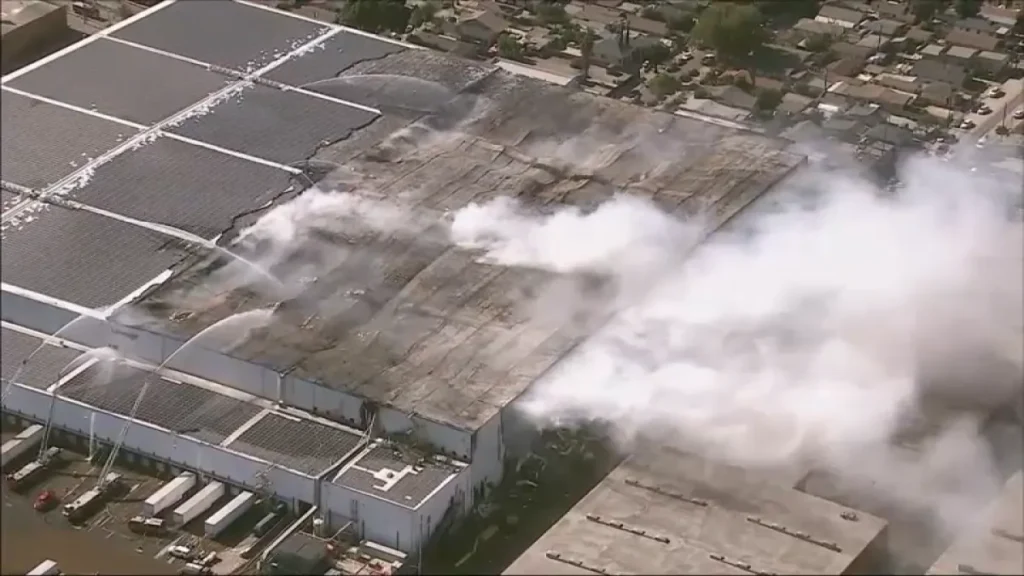
USC is offering free soil testing amid Boyle Heights pollution concerns
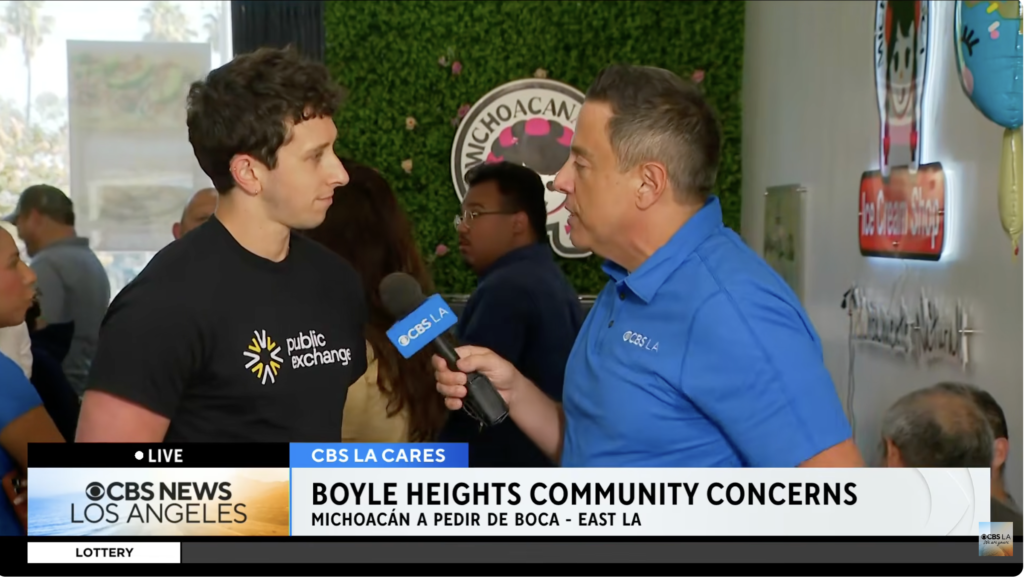
CBS LA Cares hears from East Los Angeles residents at ice cream social event
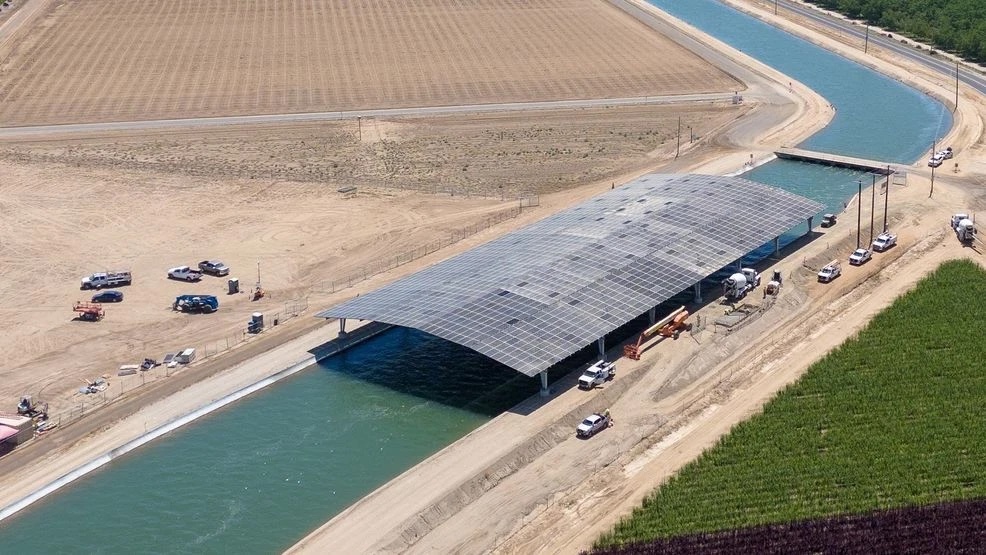
California Needs Water and Clean Power. It Might Have a Fix for Both.
Related Projects

- USC
Testing L.A.’s oceans and rivers after the 2025 wildfires
Measuring water quality post-wildfires to understand potential health and environmental risks.
- USC
Greening L.A.’s hottest streets
Bringing more trees, shade, and fresh air to L.A. by identifying where, what kind, and how many trees to plant for the biggest impact.

- USC
Tracking climate stories on screen
Tracking how climate stories impact the TV and film industry—and how they shape audience perceptions of climate change.